

Insight Lander's Mars Weather
Data can be delayed several days
More Detailed Information Courtesy of NASA Mars Insight Mission.
3 Day Weather Observations
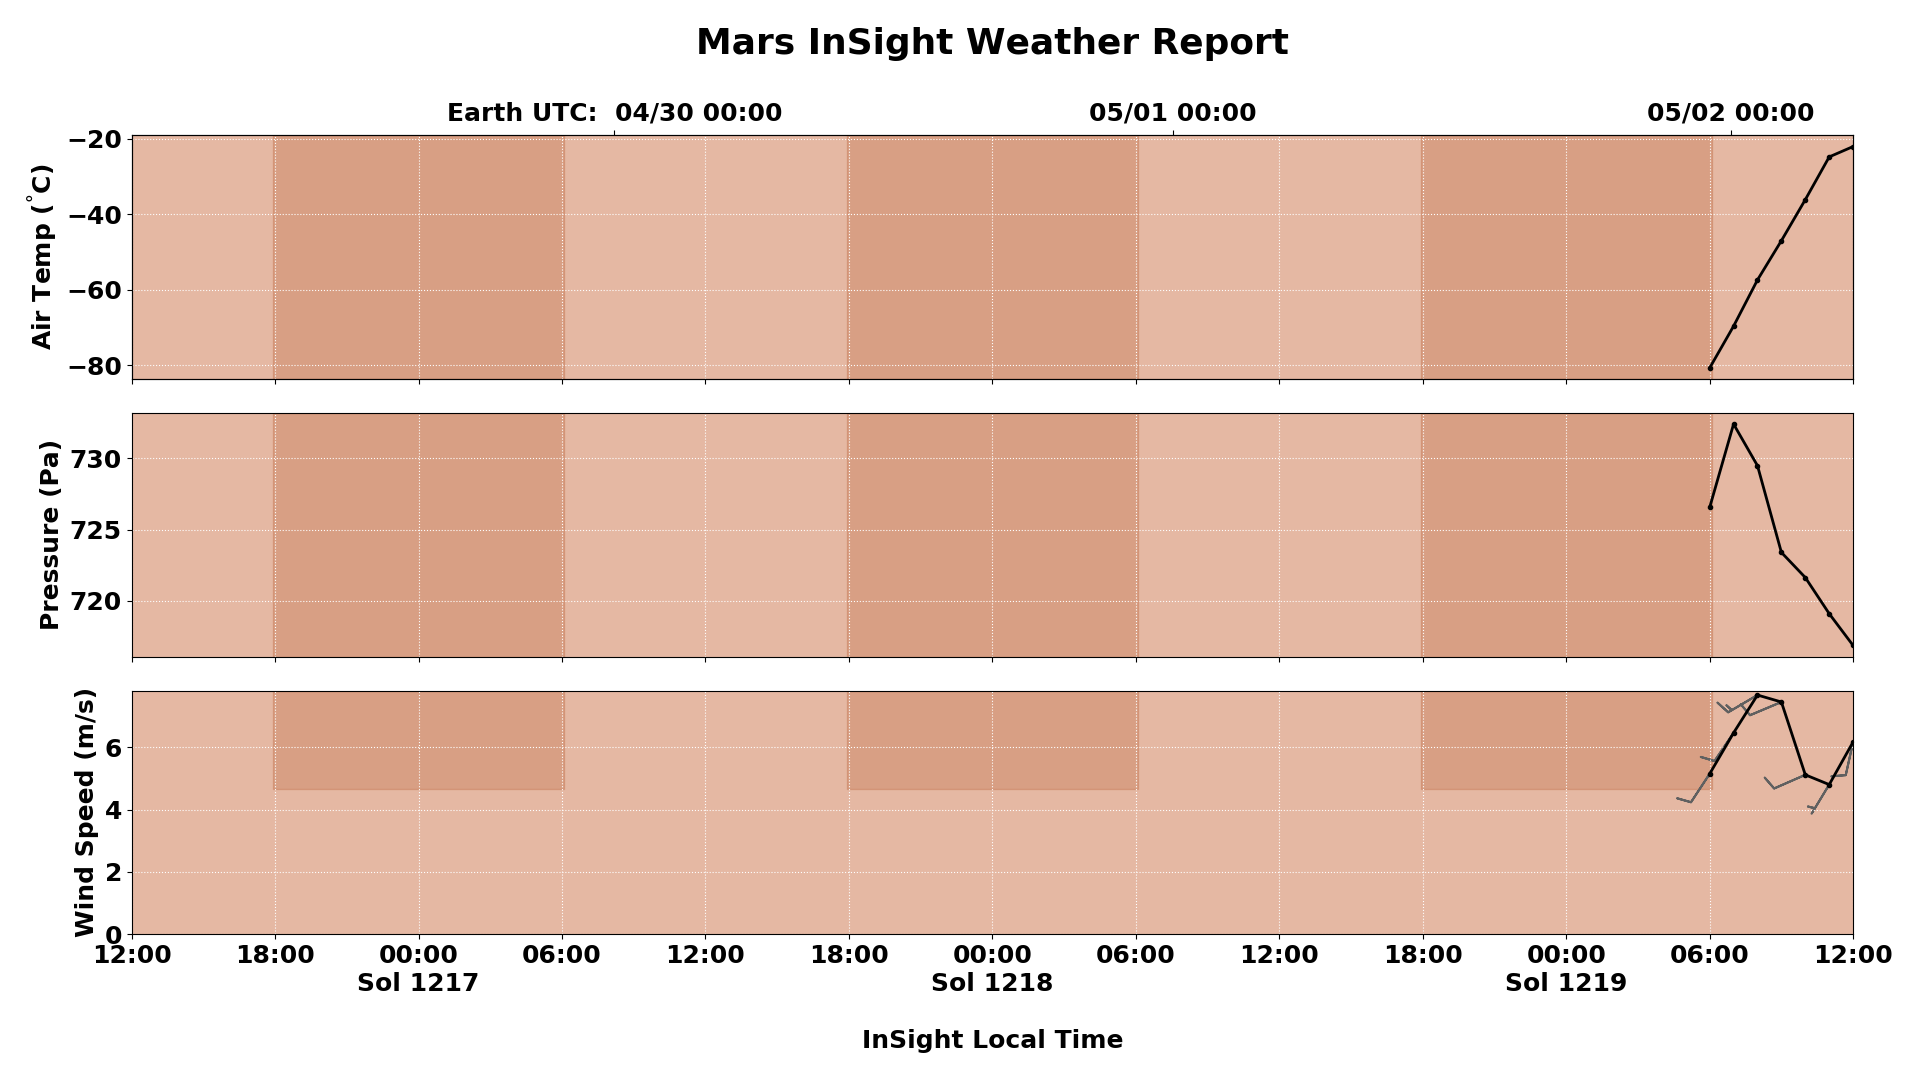 Graph of the Weather Report at Elysium Planitia
This plot is being updated daily throughout the duration of the InSight mission. The plot shows the latest three sols (Martian days) of weather data at InSights landing site near the equator of Mars. Time runs along the bottom of the plot with the most recent data at the right. Numbers along the bottom show hours of local time at the InSight lander (Local True Solar Time, based on Sun angle). Lighter and darker vertical bands indicate daytime and nighttime at the lander, respectively. The corresponding Earth time is also shown at the top of the plot, in Coordinated Universal Time (UTC). All data points are one-hour averages of the calibrated data from the spacecraft.
Temperature Plot (top):
Air temperature is shown in degrees Celsius, as measured by the Temperature and Wind for InSight (TWINS) instrument.
Pressure Plot (middle):
Atmospheric pressure is shown in Pascals, as measured by an air pressure sensor, which is part of the Auxiliary Payload Sensor Subsystem (APSS). Typical sea-level pressure on Earth is around 101,325 Pascals.
Wind Plot (bottom):
Wind speed is shown in meters per second, as measured by the pair of TWINS booms. The barbs extending from each wind speed data point indicate the compass direction of the wind (e.g., a wind blowing from the north will have a barb straight up above the point; a wind blowing from the west will have a barb off to the left). Full and half flags extending from the barbs indicate the wind speed, with each half flag representing approximately 2.5 meters per second. A circle in place of a barb indicates a wind speed less than 2.5 meters per second.
Image credit: NASA/JPL-Caltech/Cornell/CAB
 page views since 4/29/2009